Red Sky at Night, Sailor’s Delight
Red Sky in Morning, Sailor’s Warning
Just a few weeks ago, RBAC published “Has Shale Production made us Hurricane-proof?” which examined how hurricane damage comparable to the 2005 Katrina and Rita storms might impact the natural gas markets today. This analysis coincided with what was feared might be a 1-2 punch from Laura and Marco. Though Marco fizzled out quite quickly, Laura developed rapidly into a Cat 4 hurricane and made landfall right in the Cameron/Lake Charles Louisiana corridor. This has provided the U.S. domestic natural gas market with its first true test of LNG export terminals’ ability to weather such powerful storms and what the potential impacts might be on LNG exports and Henry Hub prices.
The Hurricane-proof analysis focused on demand sector impacts, specifically industrial demand. Using the Katrina/Rita impacts as analogs we assessed Henry Hub price implications in the modern era where supply is less dependent on Gulf of Mexico (GOM) production and more on land-based shale production – e.g., Haynesville, Permian and Marcellus formations. The current article examines the consequences of impacts to LNG export terminals, using the Hurricane-proof analysis as the base case and applying reductions to LNG exports for the months of September and October. Keep in mind that this scenario incorporates the slow-rise back to “normal” LNG exports that’s still occurring due to the Covid-19 pandemic.
Laura’s path essentially provided a direct hit to the Cameron LNG export facility, and though the facility itself appears to have fared quite well, the impacts to the power generation and transmission sector were not so fortunate. With Laura hitting in the wee hours of the morning, maybe the old sailor’s warning adage is true.
Figure 1 – Entergy Power Outages — Cameron LNG Facility
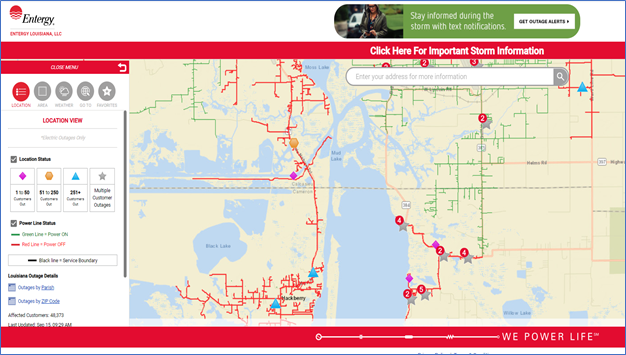
Source: https://www.etrviewoutage.com/map?state=la&_ga=2.79811743.985413888.1600092397-1759969839.1600092397
Industry participants are well aware of the issues and damage that can result from storm surge and flooding; this is exactly the analysis that was being evaluated in Hurricane-proof. As the U.S. natural gas market becomes more interconnected globally, LNG exports become increasingly important in the domestic supply/demand balance equation. Anything that impacts the ability to move BTUs through export terminals will likely have a large impact on Henry Hub prices. Using the October 2020 futures contract as a metric, prices broke through the $2.00/MMBtu level and continued to rally on August 3rd. Laura made landfall on August 27th, at 1am CDT and ironically, Henry Hub futures prices peaked around $2.75/MMBtu on August 28th Since then, prices have trended lower, bottoming, thus far, around $2.25/MMBtu. RBAC’s previous analysis suggested marginal price impacts (3 to 5 cents/MMBtu) resulting from lower GOM and south Louisiana supply coupled with lower industrial demand focused on the U.S. Gulf Coast industrial complex – e.g., refinery and petchem sectors. Now there is yet another storm heading toward Louisiana (Sally), with current tracking expecting landfall somewhere between New Orleans and Pensacola. This should allow LNG facilities to go unscathed, but an interesting question does remain; how sensitive are natural gas supply/demand dynamics to weather-induced LNG export reductions?
To test this scenario, RBAC utilized its GPCM® Natural Gas Market Forecasting SystemTM and the previous Hurricane-proof scenario as the “base-case”. Using pipeline flows and deliveries to Sabine and Cameron, courtesy of Criterion Research, one can see that Sabine has bounced back nicely from the temporary shut down while Cameron is still offline.
Figure 2 – Sabine & Cameron Flows
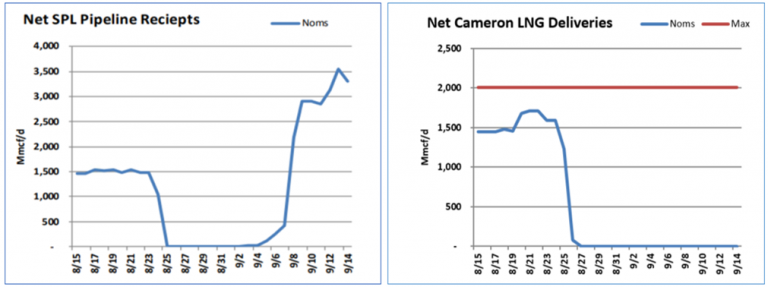
Source: Criterion Research
LNG vessel tracking indicates a vessel currently at the Sabine Terminal docks and enough traffic in the GOM to suggest September 2020 exports should only experience a marginally lower post-Laura export volumes vs pre-Laura, and possibly even higher volumes. As such, to test the potential price impacts of lower LNG exports, this scenario will apply LNG export demand curve reductions of 5% to Sabine Pass and 80% to Cameron for September 2020 and then 50% to Cameron for October 2020. The expectations are that by November 2020, all outstanding weather-induced facility issues are resolved and exports resume the “normal” trend as defined in RBAC’s 20Q2 Outlook – see our release article here.
The analysis is focused on the Henry Hub price impacts over the next several months, so the GPCM simulation was run only through 2022 – to get a sense of speed and how quickly such a scenario can be constructed and run, scenario construction took approximately 5 minutes and the model run took 754 seconds or not quite 13 minutes. GPCM’s “Make New” demand feature allows users to quickly modify demand curves which, as noted above, in this case meant reducing (or shifting the curve to the left) LNG export demand for both Sabine Pass and Cameron. This resulted in an approximate 1.3 Bcf/d decline in September 2020 and a 0.8 Bcf/d decline in October 2020.
Figure 3 – U.S. LNG Exports Reduction vs Hurricane-proof “Basecase” (Bcf/d)
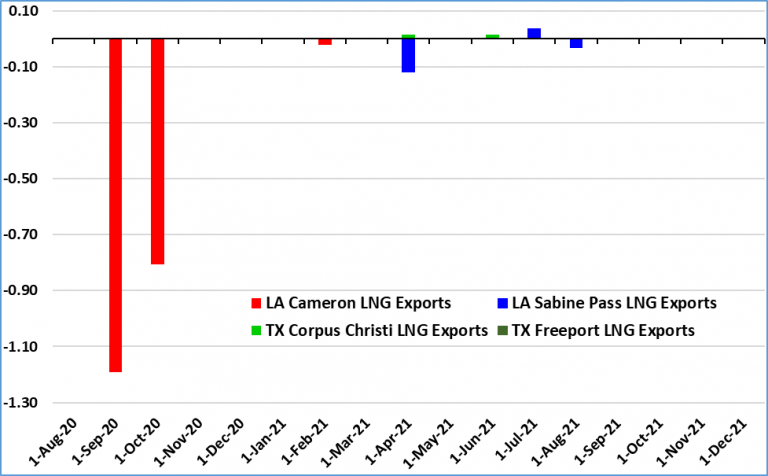
Source: RBAC / GPCM
With lower U.S. LNG exports and no adjustments to other demand or supply, as would be expected, prices in this scenario are lower vs the Hurricane-proof base case scenario. Prices in September 2020 are forecast to be approximately $0.10 – $0.12/MMBtu lower ($0.11 – $0.16/MMBtu lower than RBAC’s 20Q2 Outlook). So effectively, a 0.8 – 1.3 Bcf/d reduction in U.S. LNG export demand would infer roughly a 5% impact on prices during the shoulder months, all else being equal.
Figure 4 – Henry Hub Price Changes (Real USD / MMBtu)
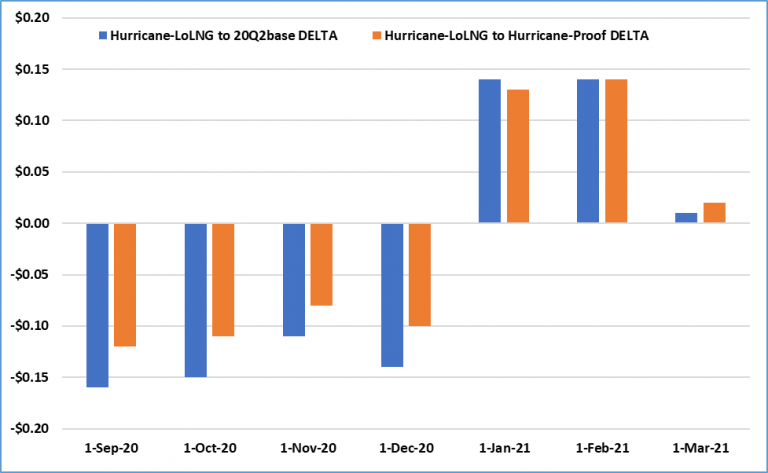
Source: RBAC / GPCM
The market reaction has obviously been much more volatile leading up to Hurricane Laura and immediately thereafter. As an example, since the end of July, natural gas prices have rallied nearly $1.00/MMBtu. It is invaluable to be able to identify when such higher volatility environments might present themselves, and what fundamental factors might create such an environment.
RBAC’s 20Q2 Outlook forecast a significant rally in prices but not until winter season was in full swing. It’s important to note that GPCM forecasts monthly average spot prices, or the equivalent to the average of the daily cash prices for a month, not the Nymex Henry Hub futures prices. But users can easily construct a variety of scenarios to test perceived market dynamics very quickly and easily to help them assess how much price volatility can be expected and when based on fundamental analysis. This can help provide metrics on how much of a move is fundamentally driven, based on the users scenario assumptions, and how much is potentially speculative positioning, or where there might be some further vetting needed on fundamental assumptions – e.g. supply or demand elasticity, power generation fuel mix / competition, etc.
The underlying U.S. natural gas market fundamentals have been changing quite significantly even from the time of RBAC’s 20Q2 Outlook release – end of July 2020. Covid-19 impacts, which started at the beginning of 2020, further re-enforced capital discipline that has been affecting producers for at least the last 18 months. The dramatic drop in crude oil prices (going negative in April 2020) and subsequent rebound, coupled with the recent rally in natural gas prices have directly impacted FIDs for the entire North America energy infrastructure. It is for this reason that RBAC continuously provides clients with quarterly GPCM updates to capture changes in infrastructure, tariffs, supply and demand curves, and improvements in RBAC’s modeling systems.