19Q3base Database Now Available!
The 19Q3base quarterly GPCM database has been loaded to the RBAC website for download.
Highlights of 19Q3base:
Henry Hub
- Henry Hub price level is lower overall due to:
- Higher Supply Outlooks for Permian and Haynesville shale in close proximity to Henry Hub
- Lower LNG export forecast in the 2022-2040 time period.
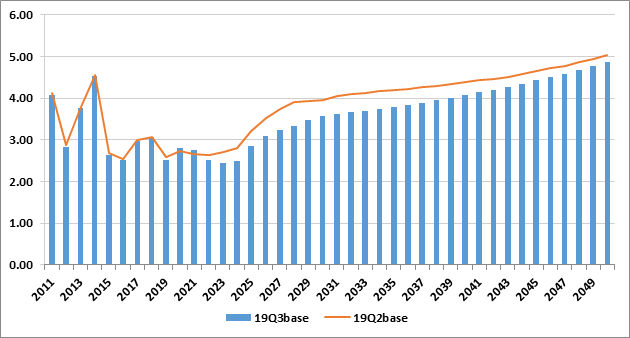
Henry Hub Price Forecast (USD per MMBtu)
Supply
- North America dry gas production is forecast to grow from 113 Bcf/d in 2019 to 144 Bcf/d by 2050, averaging less than 1% lower production than last quarter’s release
- Permian and Arkla-East Texas are the primary drivers of increased production while Appalachia growth has been reduced relative to 19Q2 as a heightened focus on capital expenditures and free cash flow throttles back spending in more gassy basins
- Arkla-East Texas production has been revised further to better reflect the production rebound in Haynesville shale, and as new midstream infrastructure will increase takeaway capacity and outlets to LNG facilities along the Gulf Coast
- Canada production forecast has been revised downward due to more conservative expectations for supply growth in British Columbia and Alberta
- Mexico production was reduced throughout the forecast due to improvements in the supply modeling processes and more accurate production decline curves
- Supply modeling processes have shifted to direct mapping to, and usage of, Rystad’s 3-stream production dataset (Dry Gas Production) for states covered by Rystad
- Rystad data correlates and matches in magnitude very well with EIA dry production data at the state level
- Rystad data is more stable and accurate at the well type level (Gas Well, Oil Well, CBM, Shale) in contrast to EIA, which enhances stability and accuracy when mapping directly to GPCM regions
- For states outside of Rystad’s purview, state data (I.E., websites) or EIA data is used to generate GPCM region equivalent time series which are then normalized to EIA’s state-level dry production data
- We’ve implemented a new Supply Outlooks methodology and process in conjunction with the shift to direct Rystad/GPCM Supply Targets mapping
- Streamlines the entire supply side development processes
- Provides for more accurate forecasts based on industry standard growth and decline curves
- Logistic or binomial growth
- Exponential, Hyperbolic, Harmonic, or Logistic decline
- Provides greater transparency and user friendly spreadsheet based approach
Demand
- Industrial sector regression demand models for Massachusetts, South Dakota, and all of Canada were updated this quarter
- U.S. impacts were minor, but the revisions materially reduced Canadian industrial demand by nearly 1.0 Bcf/d by 2050 relative to last quarter’s release
- In the US, lower natural gas prices increase overall power sector demand, though all sectors see slightly higher demand this quarter vs 19Q2
- The previous quarter’s lower Canadian gas-fired generation outlook for Canada from NEB (Canada’s National Energy Board), remains in effect for 19Q3; although residential and commercial sectoral demand are higher with adjustments to Residential and Commercial demand in Alberta Residential, Manitoba Residential/Commercial, Nova Scotia Commercial, and Ontario Residential/Commercial due to stronger recent actuals that are not part of the last update of Canadian Residential/Commercial regressions done for 18Q4base; these gains are not enough to offset the lower industrial sector demand, resulting in overall consumption being lower by approximately 1.0 Bcf/d
- Mexico’s natural gas demand marginally increases from the industrial and power sectors due to lower gas prices
- Lease and Plant Fuel demand decreases somewhat due to slightly lower dry gas production primarily in Canada and Mexico
- Demand in the 1st 6 months of the forecast was increased in the Demand Case Builder as the NOAA weather outlooks that are used for that period are more bearish than current actuals and future weather forecasts
- North American total natural gas demand increases early in the forecast period as the demand gains in US power and industrial sectors more than offset the drop in Canadian industrial demand through 2036; thereafter, the lower industrial demand is enough to drive total consumption lower relative to last quarter’s release
Physical Impacts
- The explosion in Lincoln Co, KY that impacted the Texas Eastern pipeline has been built into the model and updated with nomination flows.
- The explosion that impacted Westcoast pipeline in the Prince George area has been built into the model and updated with nomination flows.
- The SoCal system has been updated to include the Aliso Canyon Storage capacity changes and maintenance on lines 3000 and 235-2 to more closely reflect actual capacities, improving modeling results.
LNG Export Facilities
- LNG Rio Grande and the feeder pipeline Rio Bravo have been added and turned OFF.
- LNG Jacksonville and the feeder pipeline Peoples Natural Gas have been added and turned ON with very low demand.
Infrastructure
- Extensive review undertaken of the Waha and Permian areas of infrastructure to improve basis fits in the Southwest with some significant improvement realized in 19Q3base (Waha) and additional enhancements expected in 19Q4.
- Atlantic Coast, CFE Sur de Tejas to Tuxpan, MIDSHIP, Pecos Trail, Permian Highway, and PENNEAST have had their in-service dates changed to reflect delays.
GPCM version 11.0.3 Now Available!
RBAC is proud to announce the release of GPCM 11.0.3. The release will include several important improvements:
- The Pipeline Builder has been redesigned in new tabs and grids, and includes a new section that the user can use to make changes to the Pipe State Link model for computing the Cross Border Flow reports.
- The LNG Builder can now create new LNG Export Terminals, allowing a user to quickly and easily create an LNG Export Header Pipeline, customer and demand curves, and link up interconnect supply, demand links, etc.
- We’ve added six new Storage reports which will give storage use by different aggregations: Area, State, Census Region, EIA Region, Country, and Storage Type. Users can open these reports to quickly see how Storage Use in GPCM compares to historic use.
- You can quickly create an adjusted AutoExpand Case based on how much of your prior run’s range AXP was used – 10%, 20%, whatever you decide. Use this feature by clicking the AutoExpansion Analysis Detail report’s “Make New” button.
For a complete list of updates, please download the new version and see the included GPCM Release Notes document.
GPCM version 11.0.2 Now Available!
RBAC is proud to announce the release of GPCM 11.0.2. The release will include several important improvements:
- GPCM Parallel now allows users to run more scenarios when database size permits. The first release of GPCM that allowed running in Parallel was designed to only allow one scenario in a database, this feature has been updated and users can now run multiple scenarios in a single database. Please bear in mind the maximum size of your database is still 2000 megabytes, so when setting up multiple scenarios you will need to run fewer years. For example, when running with 2 demand cases, you may be able to run up to 4 scenarios of 8 years each. However if you add in a 3rd and 4th demand case, you may find you can only run 7 years each. You can run these scenarios in a batch (remember to press the Parallel button on the Batch form), or one after another.
- The Scenario Overview Exporter now has two additional reports for LNG Exports – Liquefaction and Transportation fuel. You can model these with Loss Fractions on the EXP Demand Link (transportation/boiloff) and the LNG Terminal’s Zone record (Liquefaction).
- In the AutoExpand Data form you can now filter by State or Census Region and select those Pipelines and Zones within that region.
- When importing a set of Supply or Demand curves from another database, users are now able to cancel out if desired. This feature is found on the Supply and Demand forms when clicking the Import button.
We’ve also fixed several bugs:
- When running Model Check, gaps in demand curves detected but not handled. One of our long standing model checks is to find gaps in your Supply or Demand curves and help fix them. The check could still find them but was unable to help fix them after a change to the table. This has been resolved and GPCM can once again help you fix this error.
- Scenario Overview Exporter report Monthly price and basis reports fail when in real or nominal. The Scenario Overview Exporter previously had the Price Mode feature built in, but it was not working properly. It’s been fixed.
- Rename Scenario is renaming the demand case in development (in DCB). We found that when renaming a GPCM Scenario’s subcases, the Demand Case in development in the Demand Case Builder was also being renamed (when it matched the Scenario name). This was incorrect so we’ve fixed it.
- Improved handling of 0 values in the Supply Case Builder Outlook grid. In the Supply Case Builder Outlook grid, it is now easier to change zero values to non-zero values.
For a complete list of updates, please download the new version and see the included GPCM Release Notes document.
19Q2base Database Now Available!
The 19Q2base quarterly GPCM database has been loaded to the RBAC website for download.
- Please note that you will find 2 documents on the RBAC website ready for download rather than one – 1st) 19Q2base Quarterly Documentation and 2nd) the beginnings of a new GPCM User Manual that contains information that was previously in our Appendices and Quarterly Documentation, but will be augmented going forward with more write-ups as a reference tool for our users. We welcome your comments and suggestions as we continue to enhance our materials for your use as GPCM fundamental Natural Gas analysts.
Highlights of 19Q2base:
Henry Hub
- Henry Hub price level is lower overall due to:
- Lower US industrial demand from updated US Industrial demand regressions
- Lower Canadian gas-fired generation outlook for Canada from NEB (Canada’s National Energy Board)
- Higher Supply Outlooks for Permian and Haynesville shale in close proximity to Henry Hub
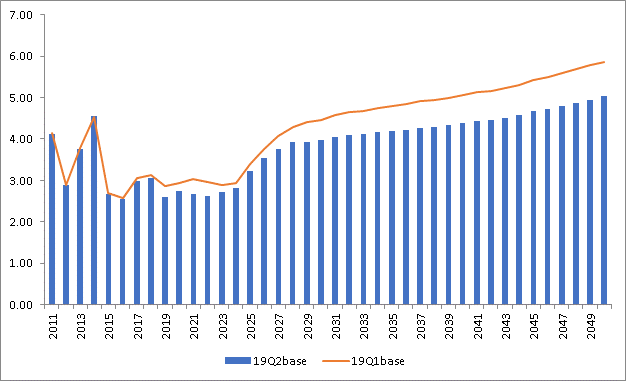
Henry Hub Price Forecast (USD per MMBtu)
Supply
- North America dry gas production is forecast to grow from 114 Bcf/d in 2019 to over 144 Bcf/d by 2050, averaging approximately 2% higher production than last quarter’s release
- Permian, Appalachia and Arkla-East Texas are the primary drivers of increased production
- Arkla-East Texas production revised to better reflect the production rebound in Haynesville shale as reported by the Texas RRC
- Continued improvement in supply model processes have resulted in better state-level calibration to EIA data
- Mexico production was reduced throughout the forecast due to improvements in the supply modeling processes and more accurate production decline curves
Demand
- Industrial sector regression demand models for the US were updated this quarter, and resulted in lower sector demand, which by 2050 is 2.3 Bcf/d less than last quarter’s release
- Natural gas demand from the power sector increases because lower gas prices incentivize greater consumption which largely offsets reduced Industrial sector demand
- Lower Canadian gas-fired generation outlook for Canada from NEB (Canada’s National Energy Board), particularly in Ontario as they are implementing energy conservation programs, refurbishment of their Nuclear power plants, and increases in other energy sources such as hydro.
- Lease and Plant Fuel demand increases, due to greater dry gas production
- Electricity and Lease and Plant Fuel combined demand more than offsets the drop in Industrial demand through 2040; thereafter, the lower Industrial demand is enough to drive total consumption lower vs last quarter’s release
Physical Impacts
- The explosion that impacted Westcoast pipeline in the Prince George area has been built into the model and updated with nomination flows.
- Scrubbing of the SoCal system has been done in view of the Aliso Canyon Storage capacity changes and the maintenance of the Lines 3000 and 235-2 lines has been built into the model to more closely reflect actual capacities, etc.
LNG Export Facilities
- LNG Jordan Cove and the feeder pipeline Pacific Connector have been turned OFF.
- LNG Driftwood and the feeder pipelines Haynesville Global Access and Permian Global Access have been turned ON.
- LNG Goldboro has been added and turned OFF.
- LNG Cameron and LNG Woodfibre have had their In-Service dates changed.
Infrastructure
- Agua Blanca, Cheyenne Connector, Risberg Line, Spire STL, and Whistler Pipelines have been added and turned ON.
- Atlantic Coast and the Dominion Supply Header Project have had their In-Service dates changed to November 2020.
- El Paso Northern Delaware Expansion, Equitrans Expansion Project (EEP), and the REX Cheyenne Hub Enhancement projects have been added.
- Extensive review undertaken of the Sumas, Aeco, Waha, and Kern River areas of infrastructure to improve basis fits in the West and Southwest. More examination is planned for the Kingsgate to PG&E area where recent run-ups in February 2019 basis have been seen in addition to other areas of the West. This phenomena seems to have been driven by events and weather in southern California and British Columbia but may have been less fundamentally driven in Kingsgate to PG&E area.
19Q1base Database Now Available!
The 19Q1base quarterly GPCM database has been loaded to the RBAC website for download.
- Please note that you will find 2 documents on the RBAC website ready for download rather than one – 1st) 19Q1base Quarterly Documentation which has more graphs and more comparisons to the previous quarter, and 2nd) the beginnings of a new GPCM User Manual that contains information that was previously in our Appendices and Quarterly Documentation, but will be augmented going forward with more write-ups as a reference tool for our users. We welcome your comments and suggestions as we continue to enhance our materials for your use as GPCM fundamental Natural Gas analysts.
Highlights of 19Q1base:
- Henry Hub price level is slightly higher in 19Q1base overall from 2019 – 2037 due to stronger gas-fired generation from the updated EIA AEO 2019 with the longer-term going slightly lower.
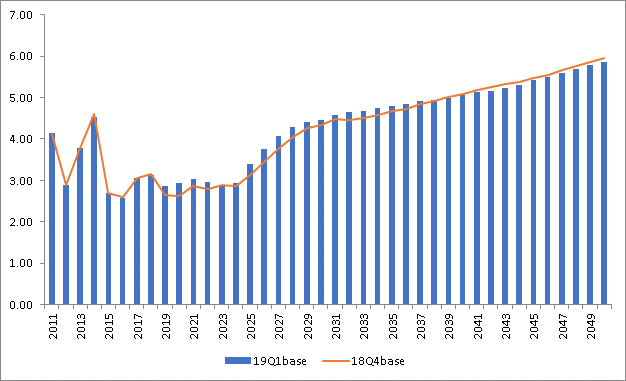
Henry Hub Price Forecast (USD per MMBtu
Supply
- Estimates for dry gas production in North America increased by 2.4 Bcf/d for 2019 but muted to become generally flat to last quarter’s release by 2050.
- Routine and exception-based methodology scrubs of our supply models have brought about a few changes in 19Q1base:
- Improved fit to EIA Dry Production for Texas supply areas
- Adjusted calculations for both Lease & Plant Fuel and Production in British Columbia and Alberta
- Improved balancing item in Mexico as a result of increased visibility into supply, demand, lease and plant fuel, pipeline fuel, and infrastructure markets there
Demand
- The 2019 EIA Annual Energy Outlook for gas-fired generation has been incorporated for 19Q1base. This resulted in increased electric gen demand as compared to last quarter as Census Region demand was significantly different due to their assumption of lower natural gas prices and favorable costs for renewables that resulted in future generation mix sensitivity.
- Natural Gas Vehicle demand was updated in the Demand Case Builder to reflect slower growth throughout the forecast time period of 2050.
Physical Impacts
- The explosion that impacted Westcoast pipeline in the Prince George area has been built into the model and updated with nomination flows.
- Scrubbing of the SoCal system has been done in view of the Aliso Canyon Storage capacity changes and the maintenance of the Lines 3000 and 235-2 lines has been built into the model to more closely reflect actual capacities, etc.
LNG Export Facilities
- LNG Calcasieu and the feeder pipeline TransCameron have been turned on in the 19Q1base database.
Infrastructure
- Brazoria Interconnector Gas (BIG) pipeline has been added to 19Q1base and turned on.
- Transco Gulf Trace and Gulf Connector as well as the Texas Eastern South Texas Expansion Project (STEP) and the Stratton Ridge Expansion project have been added to the 19Q1base database.
- Supply Links have been updated for Texas RRC6 Haynesville production to reflect the Enbridge East Texas and Midcoast gathering systems into Texas Eastern Pipeline, the Align gathering system into NGPL, and Panola County production into Enterprise Texas pipelines.
- El Paso tariff rates and fuels have been updated.
- Chihuahua pipeline has been renamed to Tarahumara Chihuahua.
GPCM version 11.0.0 Now Available!
RBAC is proud to announce the release of GPCM 11.0.0. The release will include a number of enhancements:
- GPCM 11 runs scenarios and batches in parallel threads. This allows GPCM 11 to run individual scenarios many times faster than GPCM 10, while producing comparable, and in most cases identical results. For Batch runs, scenarios can be run in parallel mode, which will simultaneously run the scenarios in one thread each, or in performance mode which will simultaneously run the scenarios in multiple threads.
- The Market Point Price and Basis with Biases report has been split into two reports, one for the GPCM (computed) Price and Basis, and a second report that shows the Bias and Adjusted Price & Basis. This will reduce confusion for new users and simplify the report for everyone.
- Improved coordination between Location form and AutoExpand Zone data. We’ve added logic that will help users by automatically creating default Autoexpand Zone data for any new zone that is added directly to the Location form, rather than through the Pipeline Builder.
- In the Supply Case Builder, we added a cancel option to load prompt: when loading a supply case using the Supply Case Builder, the user may be prompted to update the prices before loading. In prior versions, the user was given the option to update or not. Now the user will be given the option to cancel the load. This gives the user the opportunity to review the prices and be certain that they wish to continue loading or to update the prices first.
And important bug fixes:
- We’ve corrected an error in the LNG Imports Summary report that caused the Kenai Export zone to incorrectly appear in the report. It appeared because it is an LNG Header and has a supply link, but the report had not distinguished between LNG supplies and other supplies on LNG Header pipelines.
- Storage Facility Builder did not allow user to add storage plan records if you selected a storage facility and it had no plan (for example, you created a facility using the other data input forms). The plan will now be generated, and you will be prompted to update and load it before moving on. The prompt will also tell you how many records were found in your storage plan (zero in the above example).
- Demand Case Builder loaded missing demand records, even if they were not selected in State/Sector selection form. When Customer Shares records existed for a particular customer area, then even if they were zero or if the state/sector of that customer wasn’t selected, the builder was loading out a default record for the customer with a price 2 value of -1. This record was designed to trigger the model check error to bring it to the user’s attention for completion. This has been corrected in the new release.
For a complete list of updates, please download the new version and see the included GPCM Release Notes document.
18Q4base Database Now Available!
The 18Q4base quarterly GPCM database has been loaded to the RBAC website for download.
- Please note that in response to feedback from our customers at our Annual GPCM User Conference in November 2018, we have begun the process to update the way we prepare our Quarterly Documentation. You will find 2 documents on the RBAC website ready for download rather than one – 1st) 18Q4base Quarterly Documentation which has more graphs and more comparisons to the previous quarter, and 2nd) the beginnings of a new GPCM User Manual that contains information that was previously in our Appendices and Quarterly Documentation, but will be augmented going forward with more write-ups as a reference tool for our users. We welcome your comments and suggestions as we continue to enhance our materials for your use as GPCM fundamental Natural Gas analysts.
Highlights of 18Q4base
Henry Hub
- Henry Hub price level is slightly lower in 18Q4base overall from 2019 – 2050 due to slightly stronger supply outlooks and slightly lower Mexican demand.
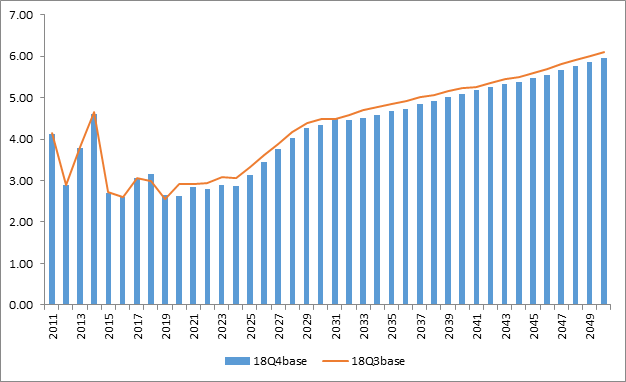
Henry Hub Price Forecast (USD per MMBtu)
Supply
- Estimates for dry gas production in North America increased from our previous release (18Q3base) by 0.5 Bcf/d for 2018, growing slightly to a net change of +0.8 Bcf/d by 2050. Most of the short-term changes are in Marcellus and Permian, while the long-term changes are predominantly in Canada; all result from data updates for 2018. Total 2018 production in the US increased 0.3 Bcf/d from last quarter. Canadian supply increased 0.1 Bcf/d on average between 2018 and 2050; Mexico outlooks changed by less than 0.1 Bcf/d.
- Supply outlooks across the US have been updated to include and reflect the latest EIA end-of-year reserves assessments (2017).
- Niobrara production was inadvertently assigned to the Denver-Julesberg ‘conventional’ supply area in last quarter’s base case release (18Q3base). We have corrected that error this quarter and moved the volume back into the appropriate Niobrara Shale production supply curve. Net Rockies production is roughly equivalent to last quarter.
Demand
- RBAC Inc. re-tuned demand regressions for 18Q4base in both the United States and Canada’s residential and commercial sectors. We anticipate updating our demand regressions for the industrial sector in next quarter’s base case (19Q1base).
- Mexico demand outlooks have been updated to reflect data from the latest Prospectiva reports.
Physical Impacts
- The explosion that impacted Westcoast pipeline in the Prince George area has been built into the model
- Scrubbing of the SoCal system has been done in view of the Aliso Canyon Storage capacity changes and the maintenance of the Lines 3000 and 235-2 lines has been built into the model to more closely reflect actual capacities, etc.
LNG Export Facilities
- LNG Plaquemines Pass and the feeder pipeline Gator Express have been added to the 18Q4base database but turned off.
- LNG Calcasieu and the feeder pipeline TransCameron have been added to the 18Q4base database but turned off.
Infrastructure
- Old Ocean and EP ET North Texas pipelines have been added to 18Q4base and turned on.
- Transcontinental Tariff rates and fuels were updated.
- Turned Off Auto-Expand for all zones located in New York State.
- Ninety Projects are now identified and linked in the “Project” screen under the Data Input->Pipelines section of the model.